In recent years, there has been rapid progress in the development of drones. The technology is becoming simpler, smaller and cheaper, and its use is therefore becoming more popular every day. This also opens up new applications and unimagined possibilities for the area monitoring for nature conservation. Even the mere imaging of large or inaccessible areas improves the data situation, nevertheless a visual analysis takes a lot of time and is limited to the capabilities of the human eye. Machine applications offer a fast alternative; therefore, a possibility of automated analysis was presented by the NaTec team during a workshop on “Analysis of drone data for quantitative nature conservation monitoring”.
Drone Workshop
A quantitative conservation monitoring with drone data
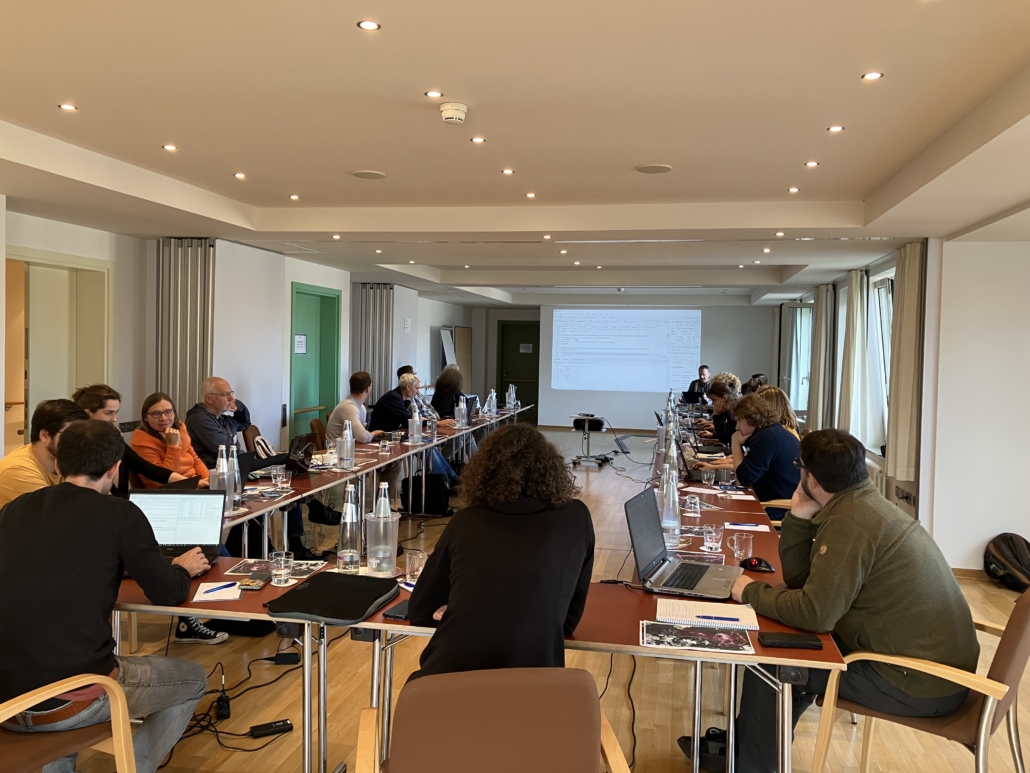
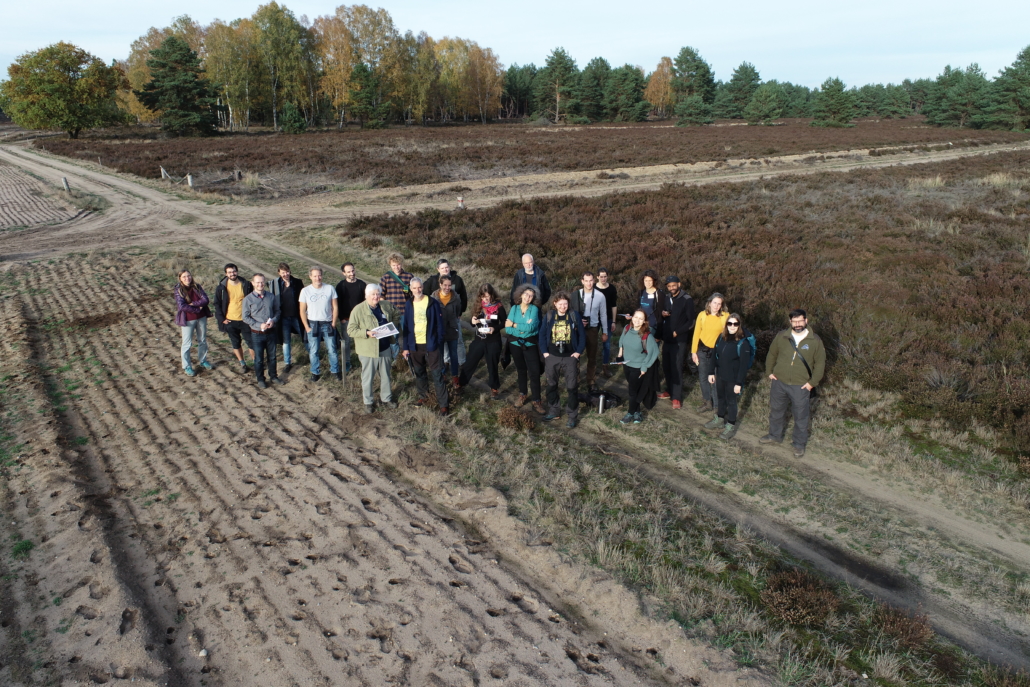
Between October 26th and 28th, 2022, 19 participants were introduced to several aspects: drone pilot Vanessa Ochlast informed about the planning of drone flights and the aspects that are important to consider for a later machine evaluation of the recordings. Dr. Carsten Neumann shared the experiences of the past project years and showed the basic application possibilities of the technologies. Already on the first day the participants got involved actively and classified the colour pixels of an example image from the Kyritz-Ruppiner Heide in QGIS. The captured area could be visited during the excursion to the project area in order to get a better orientation when viewing the images, and to identify individual objects that can be used as reference for the individual classes. These few reference points, given in QGIS, point out the remaining image pixels when processed in R.
The commands in R were provided by Dr. Carsten Neumann, who explained the individual functions and got step by step through the process of an image to a map with classes together with the attendees. Several of these commands allow for adjustments to minimize the error rate of class assignments. Moreover, in addition to the colour aspects, supplementary references to the object height or its structure can be fed in, to provide the program with further information and improve the result of the analysis. Finally, some results were presented in form of maps created according to own defined classes and everyone discussed about the accuracy of the predictions and how they could be further optimized via adjustments.
We would like to thank all participants for their interest, the valuable contributions and the good atmosphere during the time together.
images & text by E. Goepfert (Heinz Sielmann Stiftung) & Vanessa Ochlast (GFZ Potsdam)
